Predicting when a customer churn in a B2C business
Challenge
Predict churn for segments that mostly churn,specially to those on subscription contracts (month-to-month commitment). This is the original intent behind this data set.
The data set contained data on customer profiling (gender, status, tenure,…), as well as the type of contracted services (on-line security, multiple lines, phone service, tech support, streaming TV,…), and whether it has churned or not.
Solution
After some prior data transformation activities to be done on the data,to secure that data is numerical to be treated by the the algorithms, we can visualize some data:
If we plot the density diagram (smilitar to histogram) for the tenure of customers (for customers on monthly contracts only), we can obtain this plot, which is the plot we would like to predict.
ggplot(data=telco_final)+
  geom_density(aes(x=tenure),fill="black", alpha=0.2)+
  labs(x = "Tenure", y = "Customers ",
  title ="Churn declines over time")+
  theme_secun()
Figure showing density diagram of tenure, with a sharp peak in the first months.
One first learning, if you do a simple correlation analysis, is that tenure (eventually churn), has a positive correlation with total invoice value, and invoice is correlated with monthly invoice and with additional services (especially Fiber Optics, Streaming TV and streaming movies). Nothing new, customers that enjoy some specific services are more engaged and therefore are more loyal.And therefore pay more for more time!
First model to be tested
Let’s dig deeper into this. It’s quite helpful to build a decision-tree diagram using a recursive partitioning algorithm so you can see what can be done with specific algorithms like CART1 . On the bottom of the page you have a very good link where you can better understand this type of supervised learning algorithm, in this case a continuous variable decision tree. In this example, we’re using 80% of our data to train the model, and 20% to test it through (to better understand this, I recommend any reader to understand the so called train & test sampling and cross-validation technique, which are valid for improving the performance of many predictive models and are widely used).

Decision tree model where tenure of customers can be predicted based upon predictors like monthly and total charges.
Let me explain the chart: You see first the criteria that makes each customer to follow one branch or other (monthly/total charges). Secondly, in the leafs you can see the tenure in the leafs (in months) as well as how many (percentage.wise) customers lie on each leaf (from less tenure to larger te nure, in dark blue).
#Evaluate quality of prediction
pred <- predict(model_2, newdata = test.data)
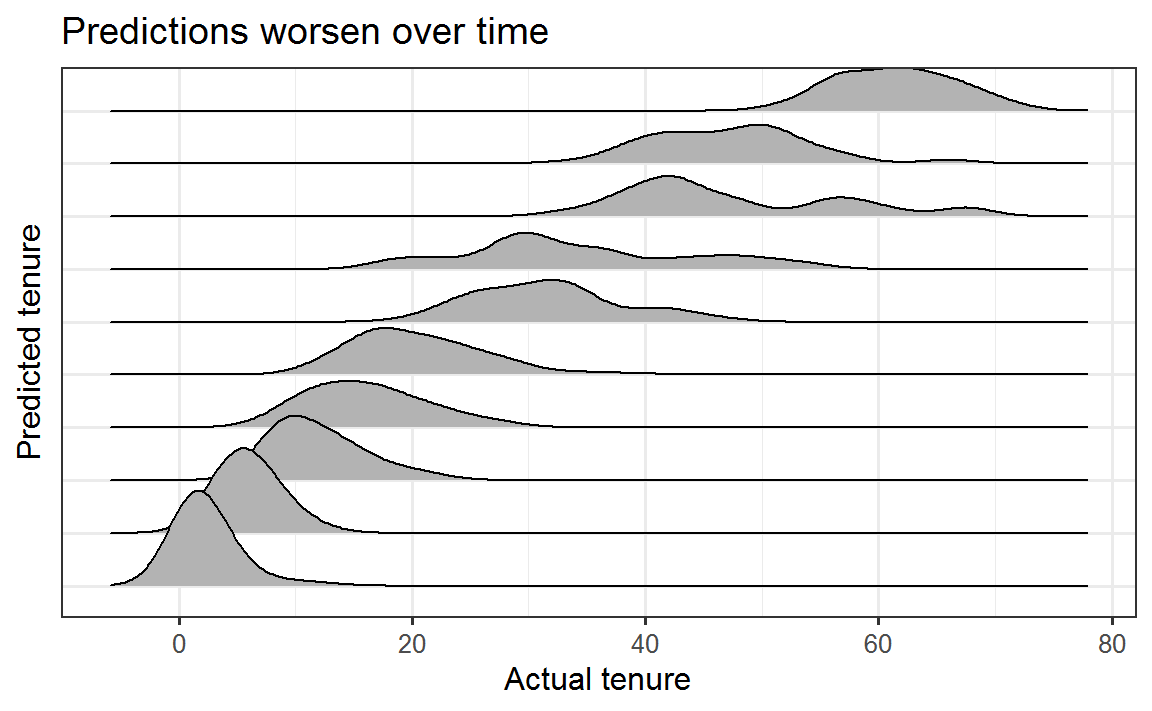
var.RMSE<- RMSE(pred = pred, obs = test.data$tenure)But this is misleading, as you can see from the graph below, because the data set is imbalanced, having many customers that churn during the first months, so not working well for tenures longer than 20 months.

Predictions work well for short tenures, but not for longer ones, where the predictions are less sharp and uncertain.
With that as a backdrop, this algorithm might be a first step to identify those customers that could churn in the 0-12 months, so very easily we are able to derive recommended (or prescriptive) course of action based upon data for them.
Second model to be tested
Let’s use another model trying to improve our ability to forecast, the Random Forest2. In brief, I’d say that Random Forest algorithm chooses random samples and builds trees for each sample, and finally re-arrange the results of these trees and is able to come up with one single tree3.
Having diverse trees is the key, so you need to secure that different data are allocated to different trees so subtle patterns can be identified.
Though the Random Forest model provides some guidance on the variables or features that could affect the churn, only less than 25% of the variance in the model can be explained through this model.
Important to mention, that this model doesn’t help to predict the tenure for each customer (RMSE is 9.446 months), so looks worse than the previous one. According to this, we found that variables like multiple lines, on-line back-up and additional services, are significant for deriving the estimated tenure.
This is a continuous challenge in Data Science, find the model that is able to perform (predict or explain) better according to the business situation.
Third, and last, model to be tested with a new approach
A logistic regression model, can predict the probability of a customer churning or not, rather than predicting when the customer would churn.
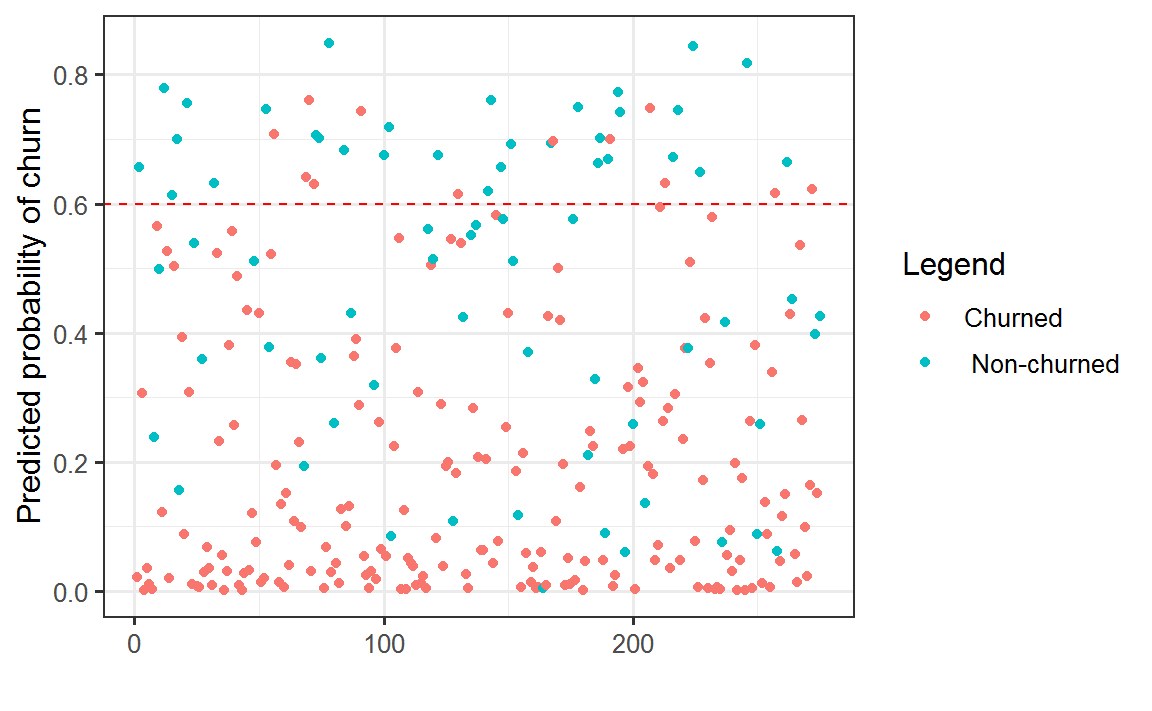
You can observe the results in the following graph, where we calculate the probability for churning and we assign a threshold to the point where we consider the customer as churned/not churned:

Figure showing predicted and actual churn: above the red line we predict all customers as churned.
| Actual.Predicted | No.Churn | Churn |
|---|---|---|
| No Churn | 69.8% | 14.5% |
| Churn | 4.4% | 11.3% |
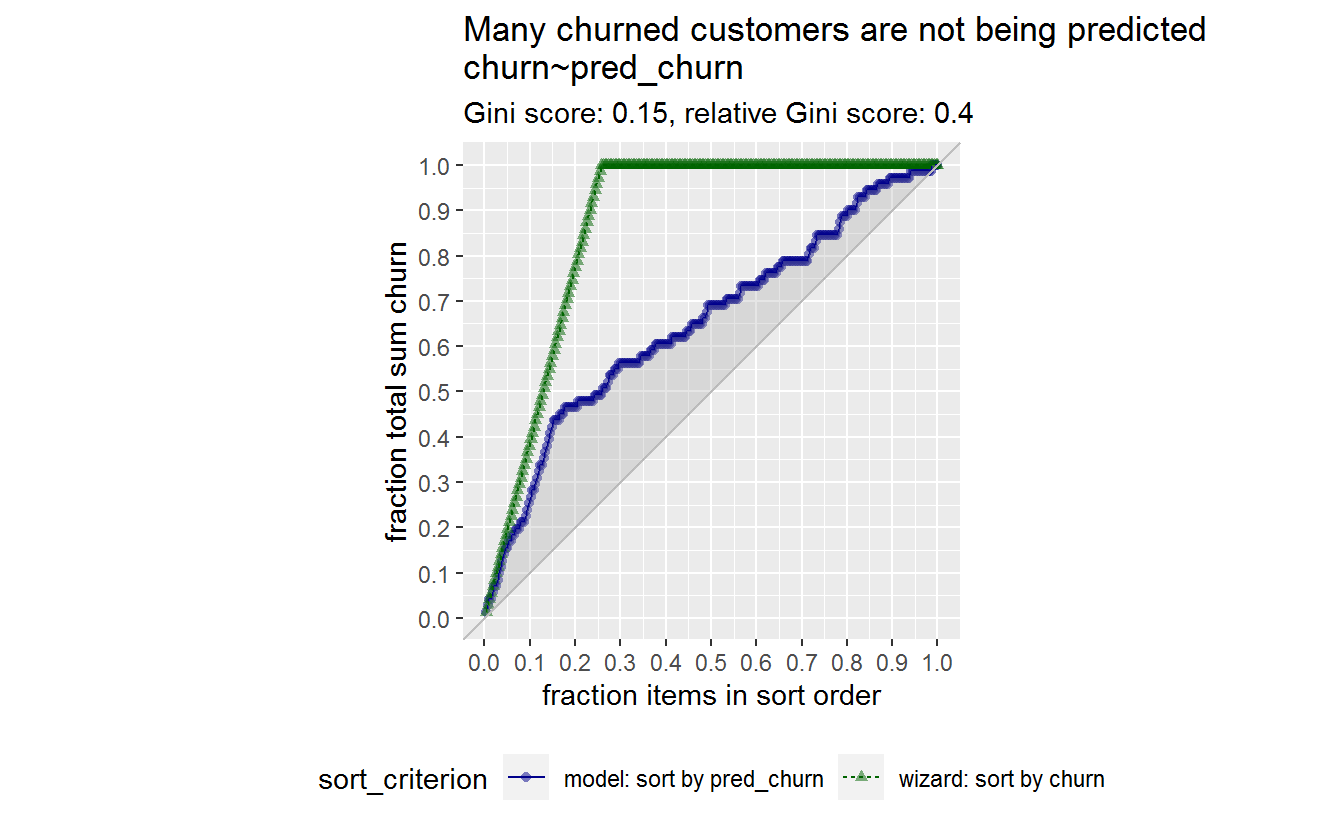
Is it as good as it looks like? This model, that provides a Yes/No response, can be evaluated under a graph where we compare our predicted churn against the actual one, an we see that with that could predict 50% of situations, and we see it’s slightly better, but not a breakthrough.

Figure showing how good we are predicting results agains a 50/50 model (diagonal line) and the real model
And here is where we realize that the model is not good. So the 81% is misleading again! This was already known: when we fitted the model to the trained data we only got a value of 0.412 for $ Nagel Kerke-R^{2}$ or 0.282 for $ Cox- R^{2}$ (remember the closer to 0.5 the better, this is pseudo−R2 not the well-know −R2 from linear regression ).
Action
To wrap up, we have created several prediction models that are able to forecast when (regression) and whether(classification) a customer will churn, and we have derived very much insight on what drives churn, identifying which services are helping the company to retain customers, so helping to define the services portfolio as well as marketing campaigns. We can realize that we move in some point between what will happen in the future (prescriptive analytics).
This is a good example of the kind of complexity and valuable insight that can be achieved with data science algorithms, as well as how quickly and easily you are able to derive prescriptive course of action based upon data or identify situations in a predictive manner.
And here is where the business rationale may add up, because marketing campaigns run by competitors are drivers for churn that the model doesn’t include now, but could be easily to plug-in.
This is applicable to many B2C companies, not only telcos, that want to increase their retention rates above 90% by having multi-pronged strategies: superior CX and compelling product proposition that fits into the market. Should you wanted to know more, send me Just a few lines!
The CART algorithm is based upon Classification and Regression Tree (CART). In this case, it’s pretty easy to make predictions without large and complex calculations, and the variables (drivers,features,predictors) that really influence the independent variable are easily identified by looking at the nodes of the tree. The simplicity of the tree has to be traded with the fact that capacity for predicting or accuracy is usually poor.↩
The Random Forest is explained here in a quick manner with one example. It’s a sort of “wisdom of the crowd”, where the results of multiple predictors are aggregated given a better predictor.↩
For a comprehensive view on the different algorithms or applicable models based upon data, I’d recommend you to take a look into MOD↩