User Insight - Design of Experiments
Challenge
An organization had been consistenly measuring customer experience and tracking complains when customers were using their products. Without having major significant gains they wanted now to identify the main drivers of customer satisfaction for their customers ( NPS was the metric used for this purpose) and uplift the different metrics.
For this specific challenge, herewith I applied positive deviance bias; basically when you notice that you’ve already solved that problem in other situation and the method to solve it might still be applicable to a great extent ,rather than reinventing the wheel.
In other words, the playbook is already there! This problem has exactly the same foundation that has been widely used in the field of industrial engineering (the DOE-Design of Experiments- will help to better understand the cause-effect relationship in a very structured manner).
Those of you working in Marketing or Customer success management roles will understand this very quickly.
It’s a pity that the the marketeers haven’t discovered this very powerful method yet, and still addressing digital problems like this one with the manual and simple A/B testing.
Solution
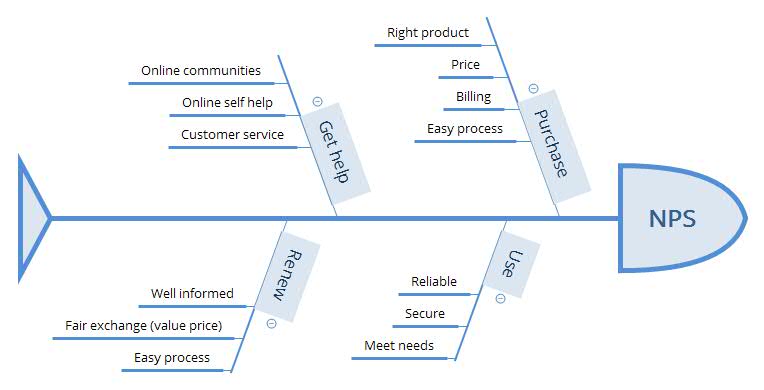
The company had already many metrics with customer feedback, so it was a matter of helping people frame the problem in the right way. Creating a fishbone diagram, which will be familiar to Lean practitioners, was the first step to align with the people and as very able to shed light on the processes, variables and responses to be scrutinized:

We simplified the problem, and decided to go after the 4 main variables/factors, and for each factor(purchase, get help,…) I created 3 levels (low, medium, high for simplicity) , so the full factorial set was composed of 3x3x3x3 experiments (you can easily create the DOE file through radiant library).
Now you have the trial file which you’re using for getting the data in. The devil is in the details, and here it’s important to note that the process of collecting this data is carefully designed and inspected to avoid getting the right conclusions from the wrong data.
Now we run our experiment, basically we create the full factorial design set, and get the response variable for each combination, keeping in mind that we’re getting primary (one factor at a time) and secondary interactions (combined effects of factors)
Let’s run the analysis on the data then (through ANOVA). Statistical output doesn’t show any concerning information regarding the data(see below); the Mean Sq explain how much of the variation can be explained through each factor (or combination of factors) and the p values show us which coefficients we should look deeper(the ones with (for more on p-values read this one ).
anova_doe <- aov(NPS ~ Purchase + Use + GetHelp + Renew +
                  Purchase * Use +
                  Purchase * GetHelp +
                  Purchase * Renew+
                  Use * GetHelp +
                  Use * Renew +
                  GetHelp * Renew +
                  Purchase * Use * GetHelp,
                data = doe.data)
summary(anova_doe)
## Df Sum Sq Mean Sq F value Pr(>F)
## Purchase 2 33.6 16.81 107.86 < 2e-16 ***
## Use 2 10.0 4.99 32.02 5e-09 ***
## GetHelp 2 0.5 0.27 1.71 0.19310
## Renew 2 3.2 1.60 10.27 0.00025 ***
## Purchase:Use 4 3.0 0.76 4.86 0.00273 **
## Purchase:GetHelp 4 0.5 0.12 0.74 0.56740
## Purchase:Renew 4 3.8 0.95 6.12 0.00061 ***
## Use:GetHelp 4 1.1 0.26 1.69 0.17071
## Use:Renew 4 3.1 0.78 4.99 0.00232 **
## GetHelp:Renew 4 0.2 0.05 0.30 0.87919
## Purchase:Use:GetHelp 8 1.1 0.14 0.91 0.51784
## Residuals 40 6.2 0.16
## ---
## Signif. codes: 0 '***' 0.001 '**' 0.01 '*' 0.05 '.' 0.1 ' ' 1Therefore , Purchase, Use and Renew explain a great deal of the variation1, and have a significant p-value too. In a second order , we can identify interaction factors like Purchase:Use, Purchase:Renew and Use:Renew . We can therefore calculate a general model for NPS,and getting to know its coefficients for a linear adjusted model2:
So, we can conclude that a possible model for predicting NPS would be something like this simple formula, where one-factor and two-factor interactions have been factored:
NPS∼7.86+0.84PurchaseH−0.22PurchaseM−0.62PurchaseL−0.40UseH+0.38UseL+0.02UseM
−0.89RenewL+0.51RenewL+0.38RenewM+(multipleinteractions)
where the variables Purchasex, Renewx, Usex and GetHelpx will be {0,1}.
The model is predicting how much any factor will reduce or increase the NPS score, so we can screen the most critical ones.
For the linear model to be applicable, the data need to fulfil several requirements, that are described here3.
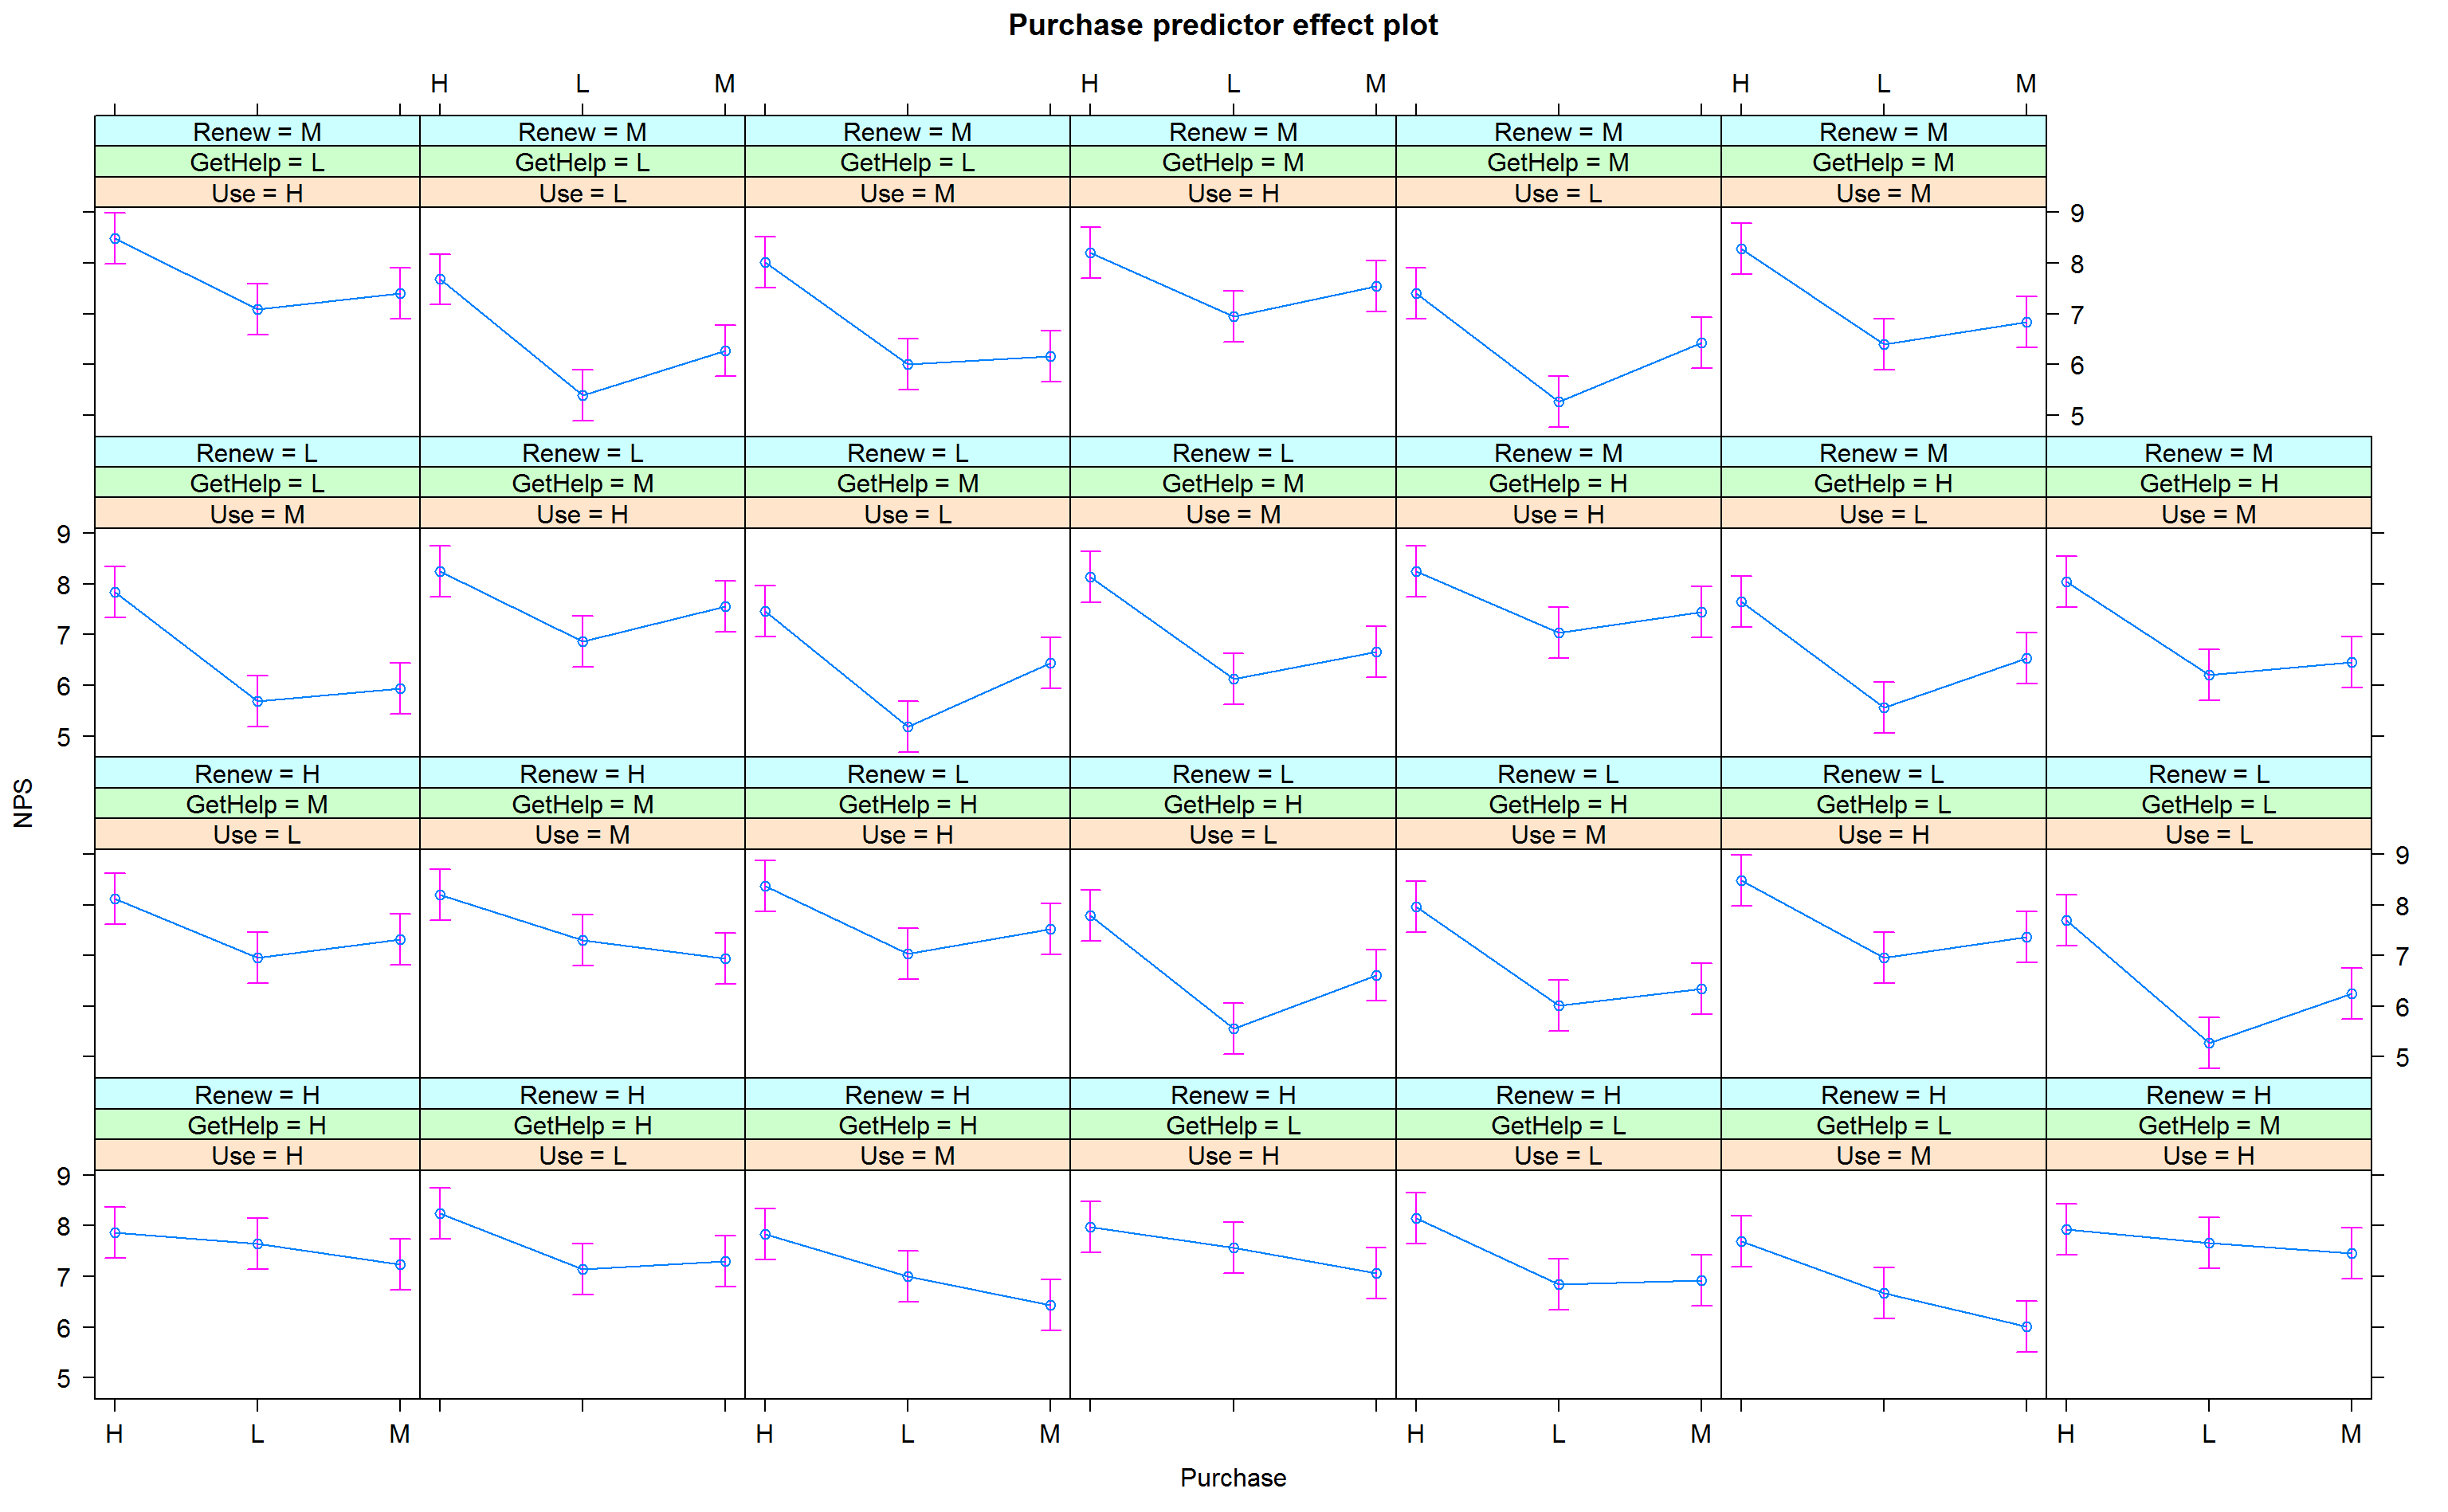
Lets plot Purchase, Use and Renew to see their influence on NPS then:

Plot shows how NPS varies when Purchase, Use and Renew have different values as per buckets Low,Medium and High.
Action
Let’s recap briefly what we have achieved:
- We wanted to understand which drove most NPS value for customers, so we were able to start focusing on the touching points that have a major impact on CX.
- All customer touch-points were aggregated and eventually we ended-up with four major variables/factors (purchase, use,renew and get help).
- Then we measured how moving each of this factor or predictor could affect the response variable (NPS).
- And eventually we found the first-order factors, main and 2-way interactions of those variables driving the CX, so in this way we found where to pinpoint to improve significantly the overall customer’s perception on NPS.
All in all, we see how a multiple regression model has a twofold outcome; can help identify the predictors that are more important to understand the relationship with the response variable and at the same time it can help to predict future values. This will be applicable to many classification and regression models, where model’s predictability or explanation and trade-offs when developing these models.
Total variation is made up of two different components; the variation that our model can explain, and the variation that cannot explain. If the former is higher compared to the total, we can feel satisfied by the model we have created.↩
With the data coming from the ANOVA,it would be enough to adjust our model to a linear one with the predictors that explain majority of the variation and removing the intraction-factors interactions. The process of variable selection deserves one specific discussion where there might be several options (like backwardm,forward or best subset selection ), so prefer to not describe here for simplicity.↩
- When running a multiple test regression analysis the following conditions need to be met:
First, the fitted model can explain a great deal of the variation within the model. F ratio is greater that 1, meaning that variation explained by the model is greater than unexplained variation. The p-value is statistically significant( less than 0.05), meaning that the null hypothesis H0 can be discarded, therefore a linear model can be applicable (where at least one coefficient is different from zero as per the alternative hypothesis Ha. Note also that adjusted R2 is 0.8.
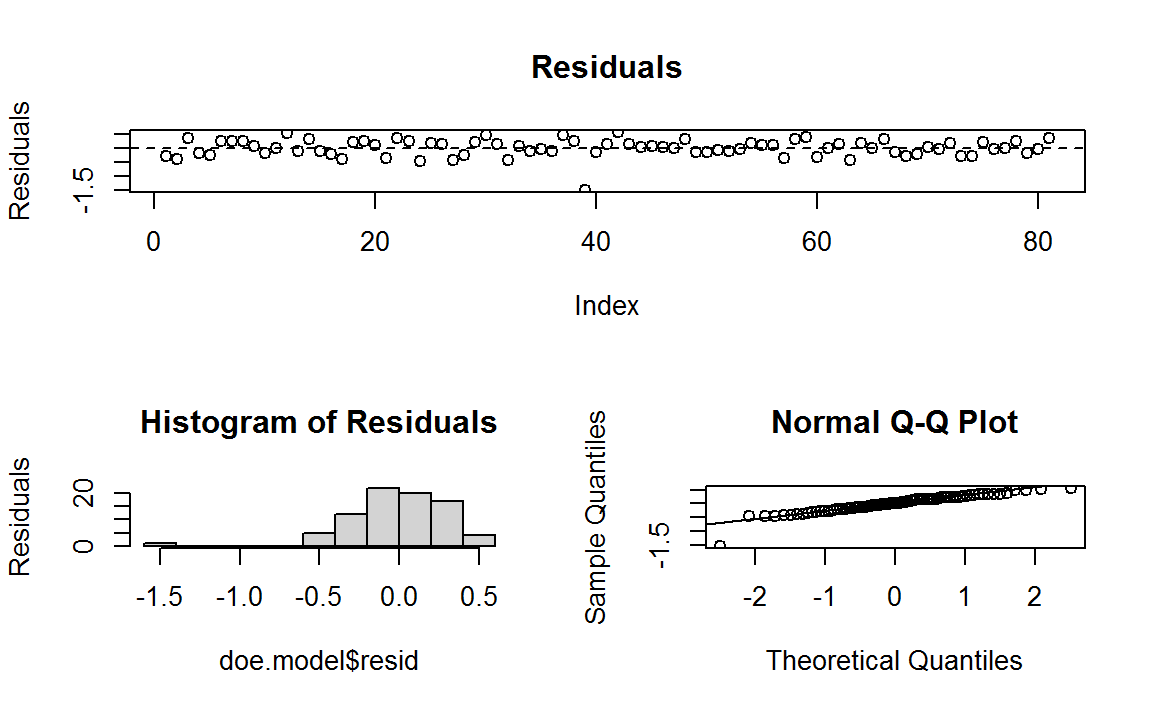
Second, the residuals analysis: if the linear model makes sense, then the residuals will have a constant variance around zero, be approximately normally distributed (quantile distribution), and be independent one observation of another over time (residuals over row number).
Plot shows residuals adherence to expected statistical criteria.
Interesting to note an outlier was identified, so highlighting the importance of doing these tests in a regular fashion and determine what to do with these specific measurements (measure its influence, taking more data)↩