Business planning gaps
Challenge
A company operating in high-tech consumer products noticed that eventually there were customer complaints (regarding key products not available) and a pressing need to increase promotions and discounts in some specific products (impacting not only the brand but the margins). Initially the problem pointed out to how the portfolio of products was managed, due to sales and forecast not being in synced, though the head of sales had a nice graph (similar to this one done in excel) saying that forecasts and sales were very much synced.
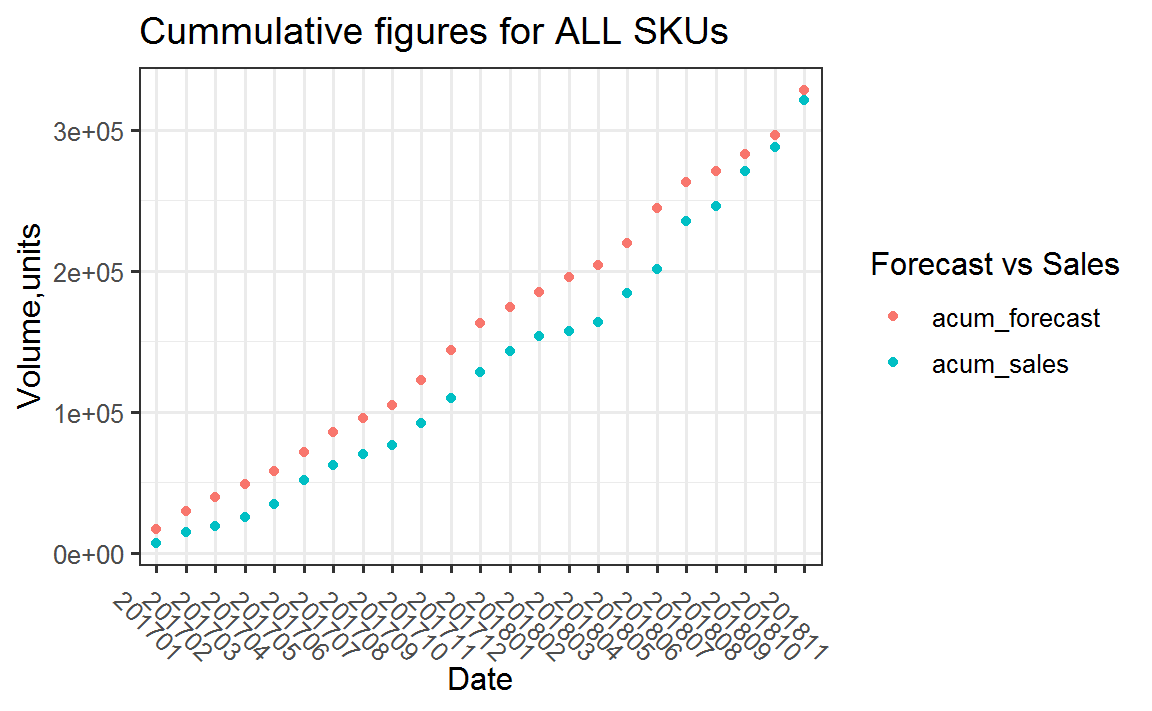
Figure showing cumulative evolution of forecast and sales, where little variation seems to exist.
Alongside this graph, there seems to be no major issue: the accumulated forecast and sales data are synced over time, and we see that forecasts goes just slightly beyond the sales (with a deviation close to 10%-15%).
Solution
In this situation (200+ SKUs, weekly sales of units ranging from 0 to 20,000, variable discounts too), I fetched historical data to understand how forecasts and actuals trended over the past months in terms of accuracy, and we got the number of units sold and forecasted by month and by SKU. Fab when you can get the data in just one iteration!
To start with, it’s worthy to do an exploratory analysis on data so you can capture trends & patterns. As an example, we can observe the long-tail of sales: 80% of the sales are driven by less than 30% of the available SKUs, and there are a few SKUs where where the sales are disproportionately high compared to the remainder SKUs.
Looks complex, don’t you think so? Pareto law again!.
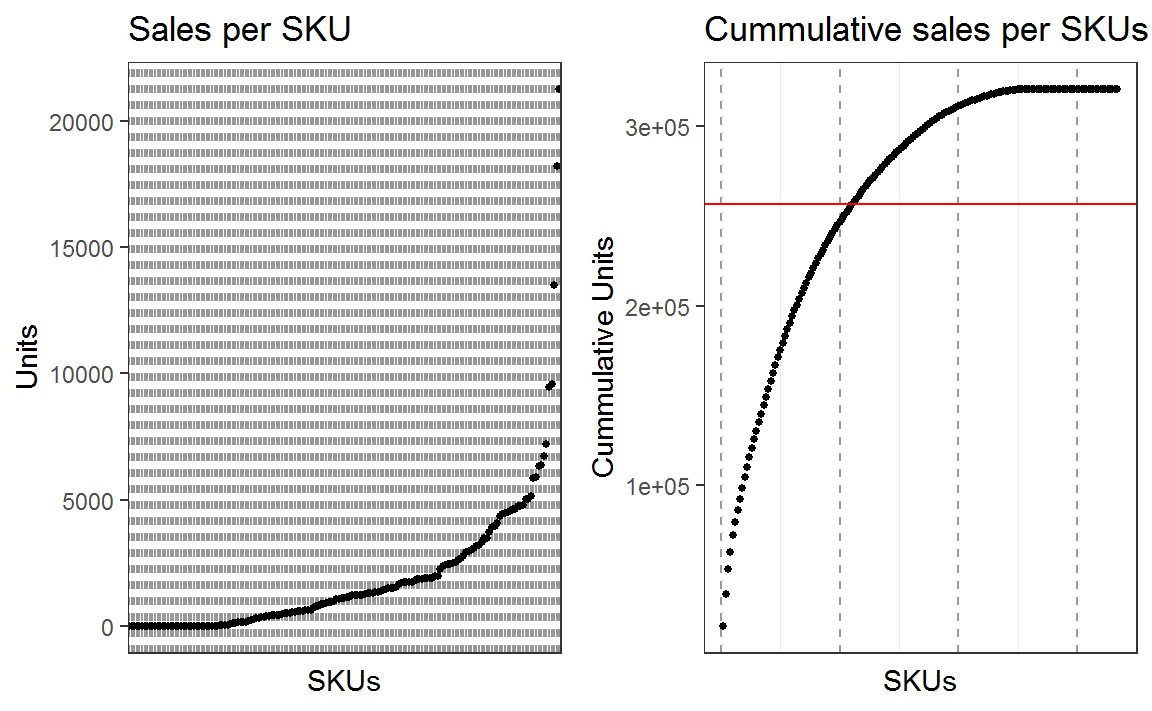
Figure showing sets of SKUs, grouped by differences in sales vs forecasting.
Hypothesis: the importance of getting the sales-forecasting process extremely well-done for some specific SKUs is paramount, and good enough for the remainder of them. Let’s see how we can work this out!
To find out those specific SKUs, we can use PCA techniques, basically, instead of working in a space with 200 SKUs, reducing the problem to a few ones through dimensionality reduction. The PCA algorithm can help us here to identify those specific SKUS that are driving the differences up and down. In the following chart I want to explain two things:
1) The first one, you can see how the variance in the deltas of forecast-sales can be explained up to 22.4% with the first dimension, and 11.6% with the second one , and so fort. SO two variables are able to explain 34% of the variation
2)The second one captures the the behavior of different SKUs, so they can be grouped by dimension (dim 1 in this example), so we can identify them:
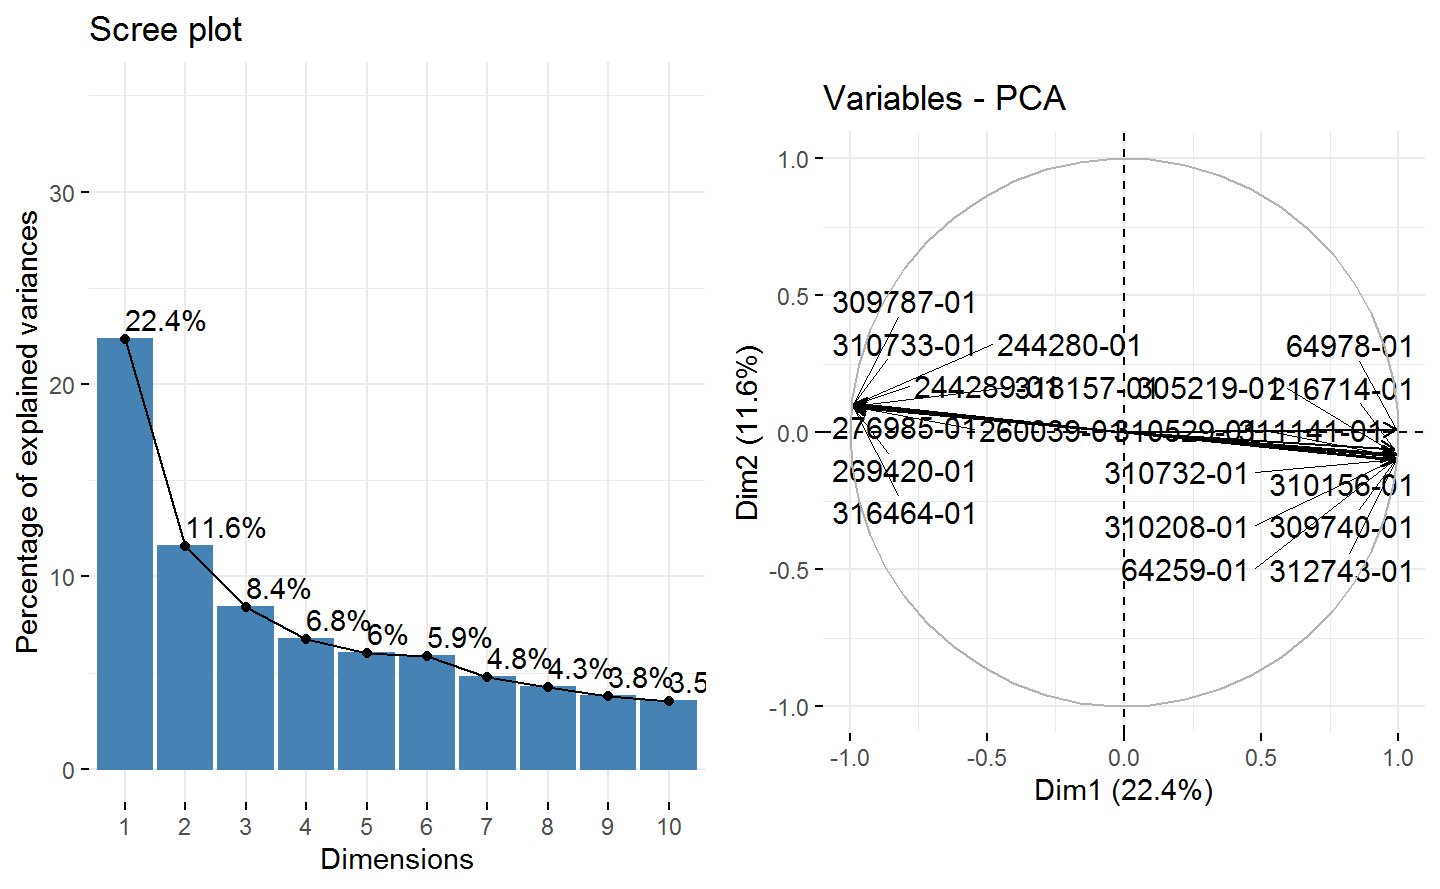
Figures showing how well this new model describes the variance in forecast vs sales, and which 20 SKUs drives the major contribution to the variance.
There is a similar option to find those weird SKUs :if we plot a dendrogram (or hierachical cluster), we can easily capture the SKUs that are driving the deviation in the deltas between sales and forecasting :
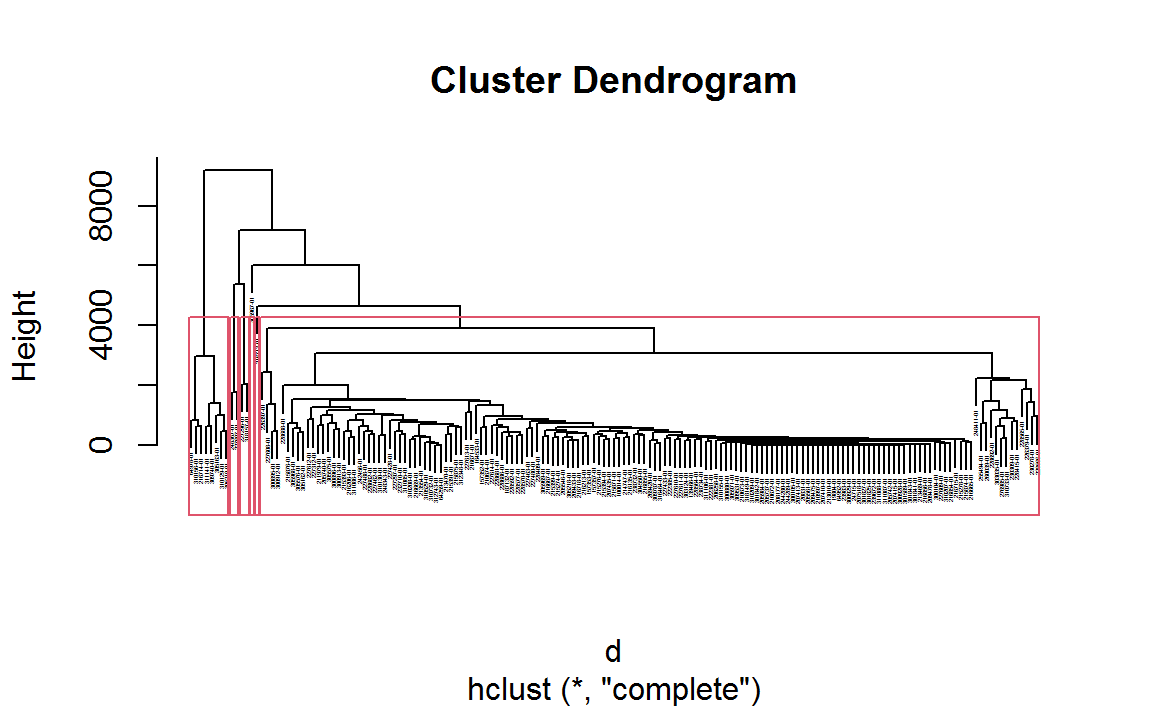
Figure showing the SKUs grouped by relative differences between them.
How to read this graph? Vertically, you can see groups at different heights, i.e., they are different according the parameters under consideration. Horizontally, one group contains most of the SKUs, while others contain just a few.
Note that we’ve done a cut at the height of 4,000 (the red rectangles) , and we can observe that to a great extent one set of SKUs are grouped under the same umbrella, however for a few SKUs,they are grouped under different umbrellas or clusters. We can identify within these clusters, the SKUs that are well forecasted in the process process with little deviation, and also the ones that produce a major deviation on the accuracy of the forecasting.
With either of these two methods, we can identify these specific SKUs, let’s call them the “weird SKUs”. Identifying them we can therefore understand the drivers of the sales-forecasting deviation.
Now, with a graph for the SKUs that drive variation in forecast accuracy ,and on an isolated basics and not cumulative (where differences tend to be averaged and smoothed), we can observe again deviations in forecast and sales in several months. While this problem wasn’t very critical in the beginning of the period being measured, it’s being quite significant in the right side of the chart (over the last few months under measurement).
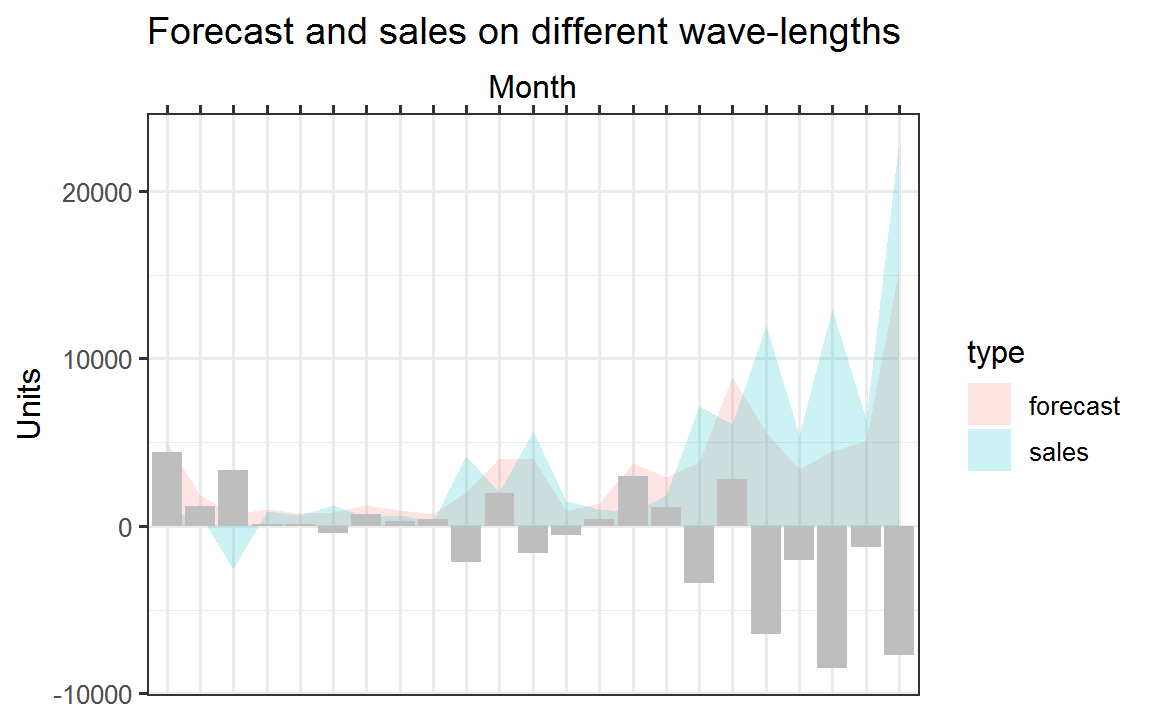
Figure showing monthly forecast and sales, as well as the deltas on the grey bars.
With that in mind, I analyzed the so-called weird SKUs, so I was able to identify the deviations, and also noticed how the problem was widening over time (intensity of colors and number of SKUS with dark colors).
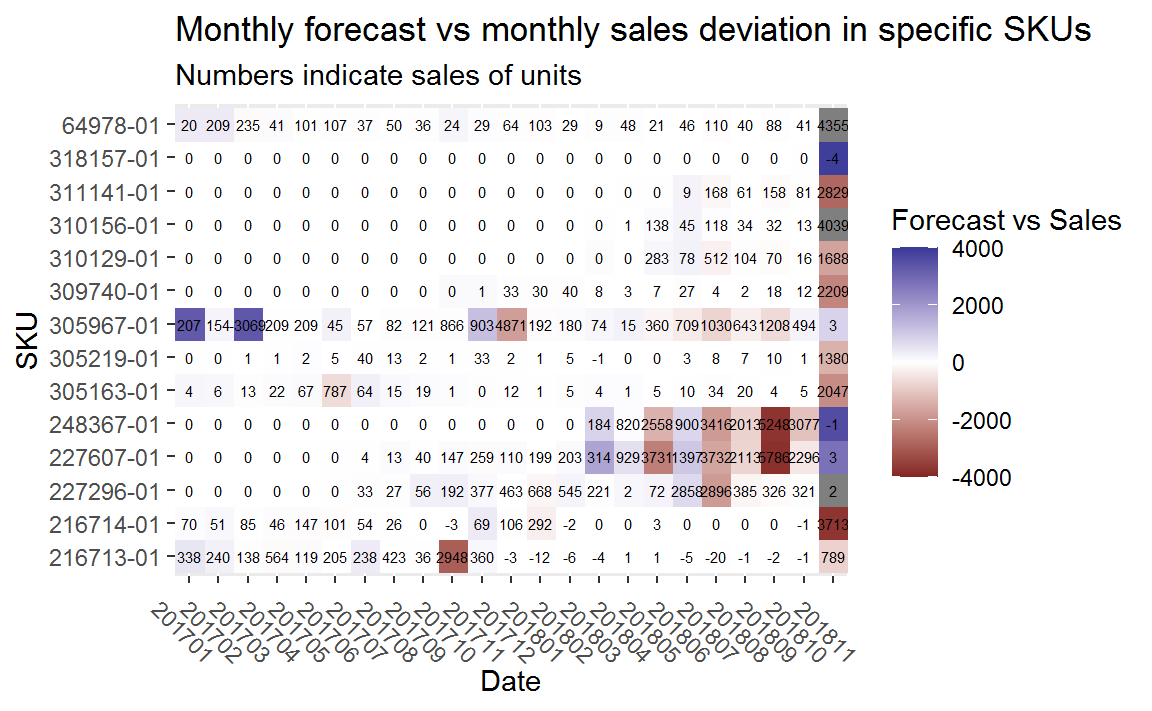
Figure showing deviation of sales and forecast for weird SKUs.,including number of sold units and degree of deviation.
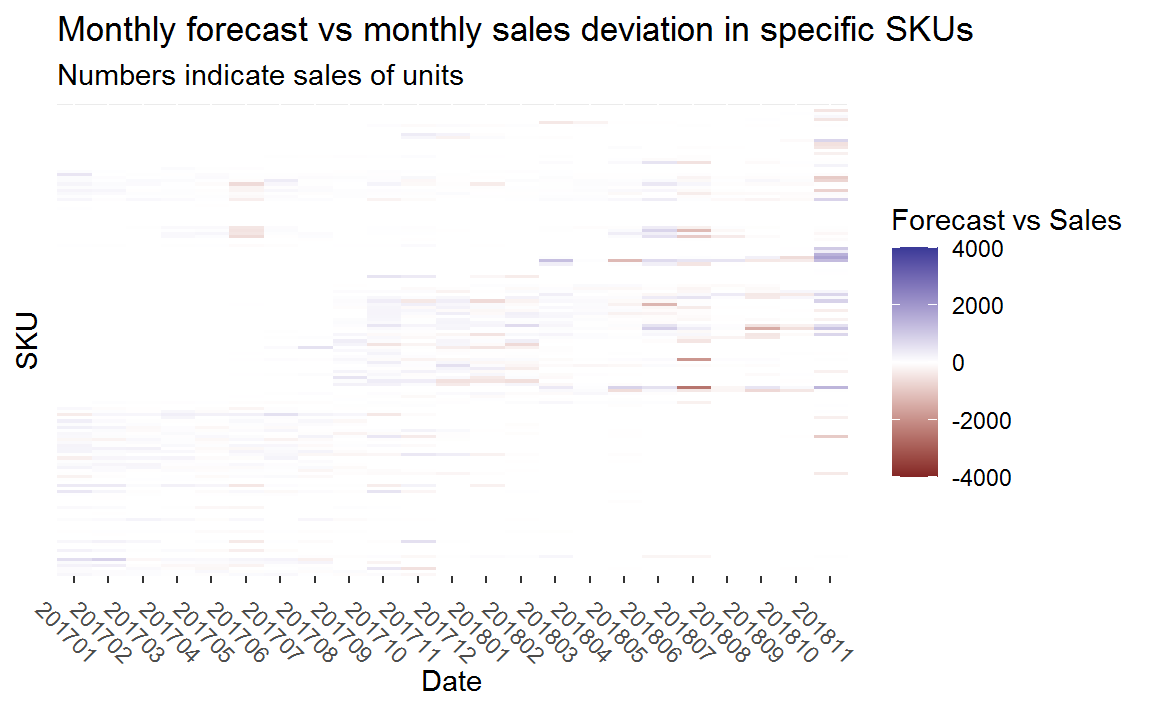
Figure showing deviation of sales and forecast for non-weird SKUs,including degree of deviation.
Now, reading from the colors we see immediately that deviations are present in the last month for some SKUs, but for the remainder it’s quite bright, without any relevant dark colors, meaning deviations are tiny.
An additional graph,done for the weird SKUs only, shows a complementary graph from a value extraction point of view, to secure we’re acting on the SKUs that drive margins too (volume and value).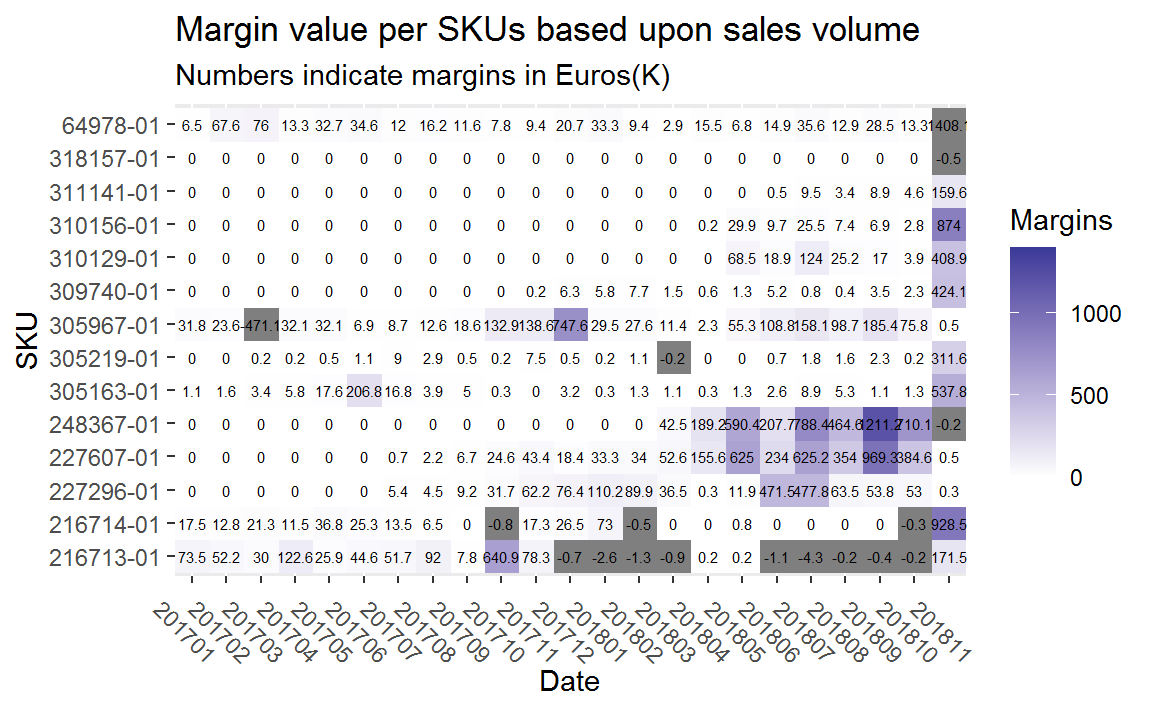
Figure for weird SKUs,noting margins per SKU.
Now we know where/when we had the sales-forecast deviations (assessing the trade-off between volume/value, facilitated through the right chart) and through conversations with the right stakeholders we can understand why we had them.
We can discuss possible solutions once we had created a powerful narrative, but here the business value was to pinpoint exactly the origin of a problem, that was impacting customers, the pricing and sales teams, and eventually affecting the brand equity (can you see your crafted products with a 40% off?). This wasn’t identified as such,and the problem was widening!
Action
When identifying a problem, the first step is to discuss openly with your peers, rather than hiding it from others. This will facilitate the discussion, the engagement with people, and eventually whether you are suffering from the consequences, or are the person that has to act on the root causes, will be a team effort, never a blaming-game effort.
This is a clear example where being equipped with data wrangling and visualization capabilities, you can anticipate bigger problems, confront with the impacted people and help present a compelling way forward to any CEO with clear benefits for all parties.
Data helps during problem-identification, problem disaggregation and timely decision-making.
Should you wanted to know more just let me know.