Enabling decisions on channel performance through data
Challenge
A multi-million company operating in the FMCG sector across all geographies in Spain wanted to increase the effectiveness of its sales channel for OOH products, and after several ideas and hypothesis that had been largely disscussed by the management team there was no clear path forward.
And to be honest, I perceived how the frustation was high amongst the team too!
With limite resources, many priorities and a data set of +4,000 distributors, more than 90,000 transactions across 13 different variables in 2 very different territories in Spain.
Solution
With that as a backdrop, a 2-week sprint was run to asses the data, and having some initial discussions with the management team. Fortunately, data was easily available to analyze and without the need to do any major data transformation. A first approach when analyzing data, it to go top-down, ensuring that there’s agreement on the broad idea, and then dive into the details and discuss them carefully . Yes, the devil is in the details!
First I want to understand how broad and deep the product categories were spread over the distribution channel, and a figure like this can help:
Figure showing number of distributors and revenues (n is the number of distributors).
For this specific case, we see that a few distributors sell very much, and many sell a little. If we extend the previous graph to other families and regions, we can identify the booming product categories in terms of revenues, and how deep the channel is. After doing some data wrangling stuff, some pretty easy calculations, I could plot the sales by channel family and number of distributors…
ggplot(data=a, aes (y=total_sales,x=fam))+
  geom_count()+
  facet_wrap(~concesion, nrow = 2,scales="free_y") +
  labs(y="Total Sales",x="Family", title=paste("Capilarity by family", "(n is number of POS)"))+
  theme_secun()+
  theme(axis.text.x = element_text(angle = 310,hjust = 0))
Figure showing capilarity of distribution by product family and region.
First take-away?
In region 169 there are many distributors with low sales, and for some specific product categories there are many low-traction distributors. When comparison between regiosn id done, do note the differences in scales between them. Let’s dig deeper onto the region 169:

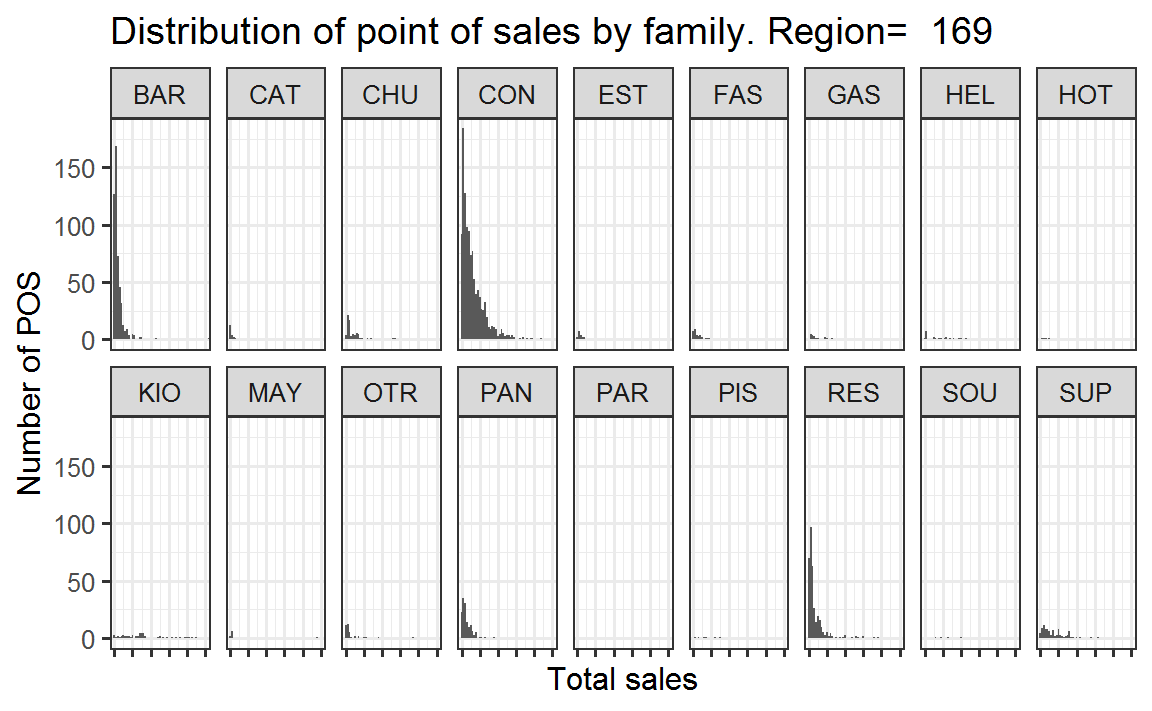
Figure showing the tail of sales across business categories for one specific region.
We see some channels very well developed (though for some of them we have a long-tail in terms of total sales), and others whose potential we haven’t tested yet. That’s true, in companies we love doing and repeating the same predictable behaviours rather than investing and risking into new ventures.
It’ wasn’t the case here.
From the first graph, one territory has a very limited amount of distributors per family, but with considerable revenues. However, it can be seen that for some families in the other territory (169), there are many distributors in the POS channel with little revenue,specially for families BAR,COM,HEL,RES,KIO,PAN,RES pointing out to the need of rationalise the channel for those families due to the fact that servicing so many POS was streching the organization to take care of or seeking innovative ways to serve small POS that were still profitable to the company.
With the second graph done,it’s even more urgent the need to rationalise the channel and redeploy resources to develop some to-be-explored families/products and grow the distributor network.
Action
Herewith you can see how data analytics engages people in the conversation as part of the storytelling and leads eventually to help frame course of actions in a more scientific-way, bringing peace of mind to a management team that was exhausted after several months with this topic on the table.
This information, alongisde many other pics, was pretty helpful to secure fact-based decision-making by the leadership team, because a collaborative and agile approach was put in place during the process: Sales, Channel,Product Marketing and Finance leaders were properly engaged, a mix of individual/team meetings were held, people were empowered to provide inputs and take their own decision. And eventually, a way forward was charted by the entire team, including the leadership team.
Data can help very much to decision-making.
Should you wanted to know more just let me know.