Gaining customer insight through data
Challenge
An organization wanted to explore and understand the value of analytics, when applied to an smart data-set before embarking into a major project to deploy real-time data AI. The smart data-set was the output of several work-streams across different departments to consolidate a common view on customers with key parameters. The smart data-set, composed of records of +7,000 customers, contains basic marketing characterization data (gender, marital status, children, tenure…) as well as financial (a list of contracted services and amount of money invoiced).
Solution
This was the starting-point to derive some insight, and the nice thing about statistics is that you don’t need to process the entire big-data set to gain meaningful insight, as long as you get a representative data-set of the entire big-data set. This is another key learning, if you can work with a smart data set instead of a big data set that could bring additional complexity, just do it!
Data is being accessed through a data repository via API in data.world, one interesting cloud repository: simple, secure and reliable.
Then I pull the data and loaded into R, examined the data, did some data cleaning and got ready for plotting some interesting charts!
CLV
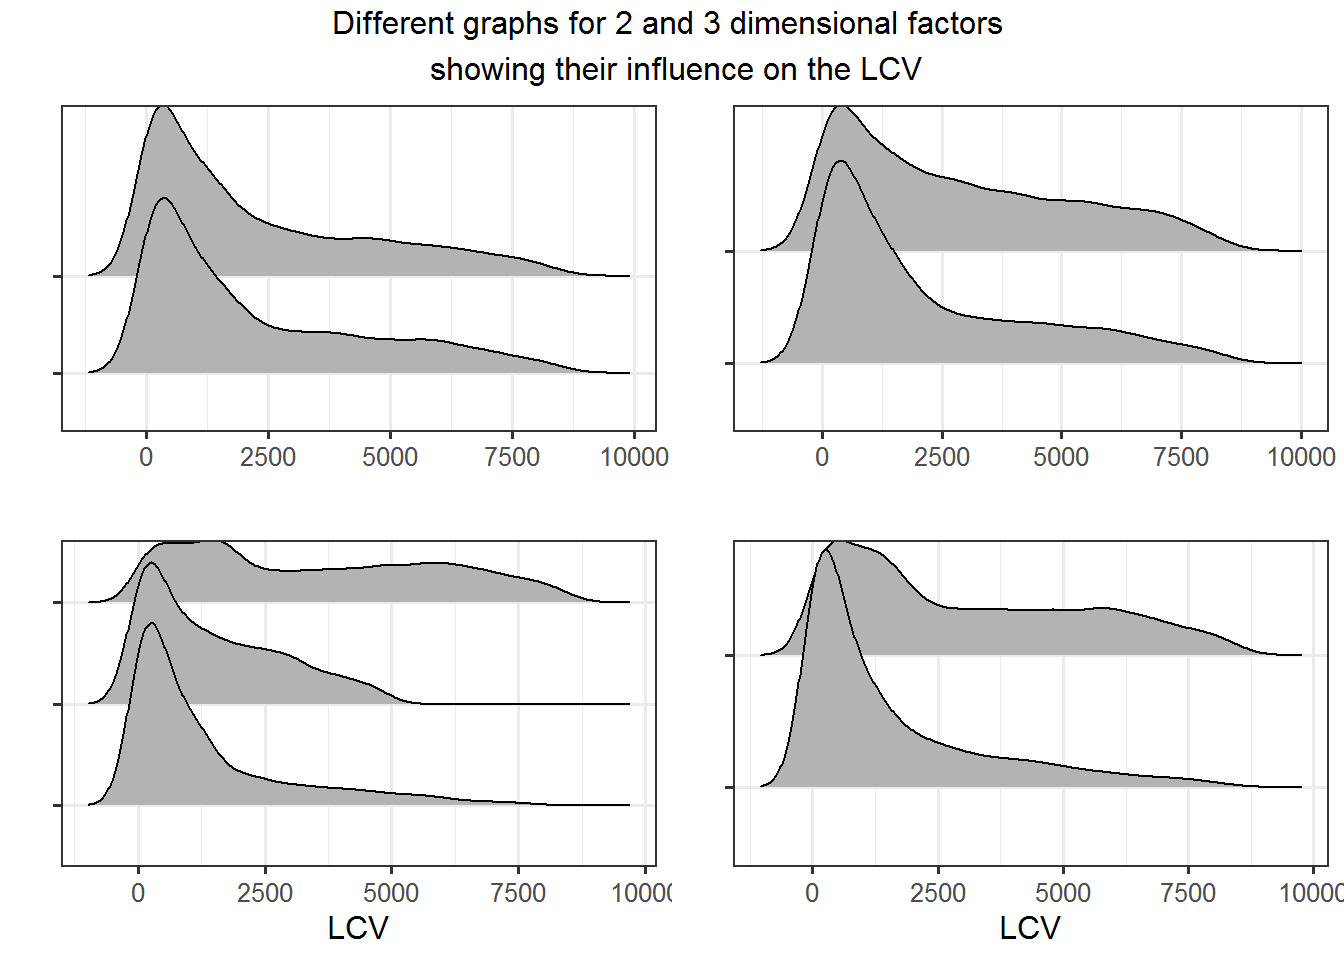
Let’s plot first the CLV (without CAC) for the different contracts and whether there has been churn or not: 
We see that lifetime value varies according to type of contract, specially for those customers that have churned,where customer with high LCV are churning.
This visual analysis can be done for any categorical variable that could affect the model to fully understand what is driving LCV (either casual or correlation realtionships).

On the top-part the two graphs, variation is not present for two-dimensional different factors, while on the bottom-part we can see how different values of factors rive a different patter for LCV.
Explainability of churn
Now we can use survival algorithms1, because they can predict when an specific event (churn) will happen based upon data, and can explain how churn (equivalent to survival function) behaves for the different values of categorical variables.
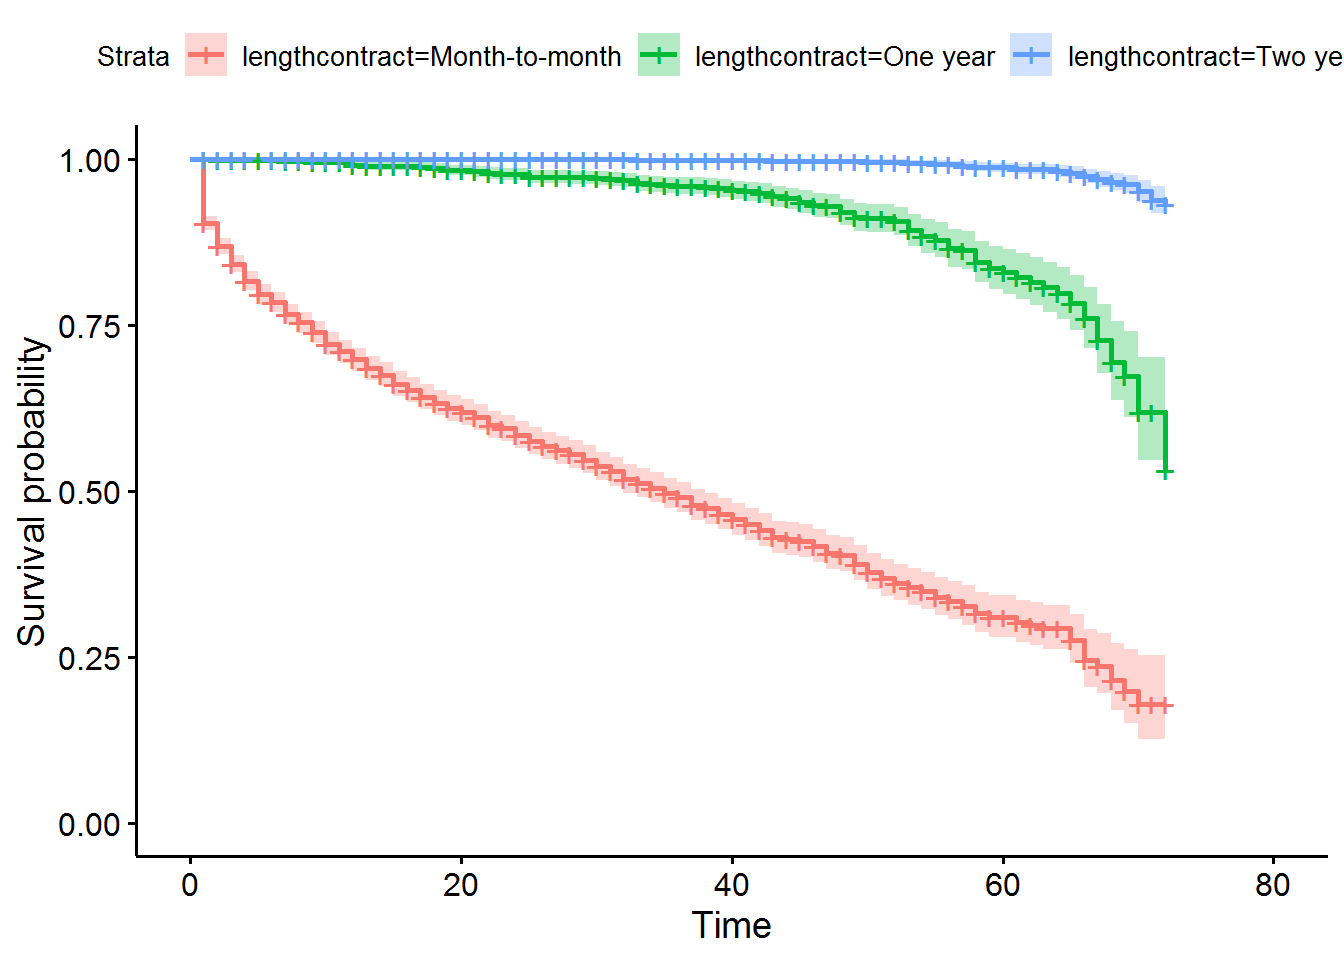
If we look into type of contract, for example, we confirm what we saw in the previous figure.
Using the [Kaplan-Meier function] (https://en.wikipedia.org/wiki/Kaplan%E2%80%93Meier_estimator) we can calculate the probability of not-churning (known as survival) for each customer based upon tenure. In this graph, we can model the pattern for the different types of contracts: 
As we saw earlier, now we confirm that the length of the contract drives largely the tenure of customers.
We can see can other variables or predictors are affecting the tenure too through this nice graph:

Churn is higher for customer with digital invoices (probably younger customers) especially for month-to-month contracts when TV-as-a-service is not in the contract. The p-value guides us to understansd whether there is an significant variation from the statistical point of view, and in 8 graphs, the variation is not significant.
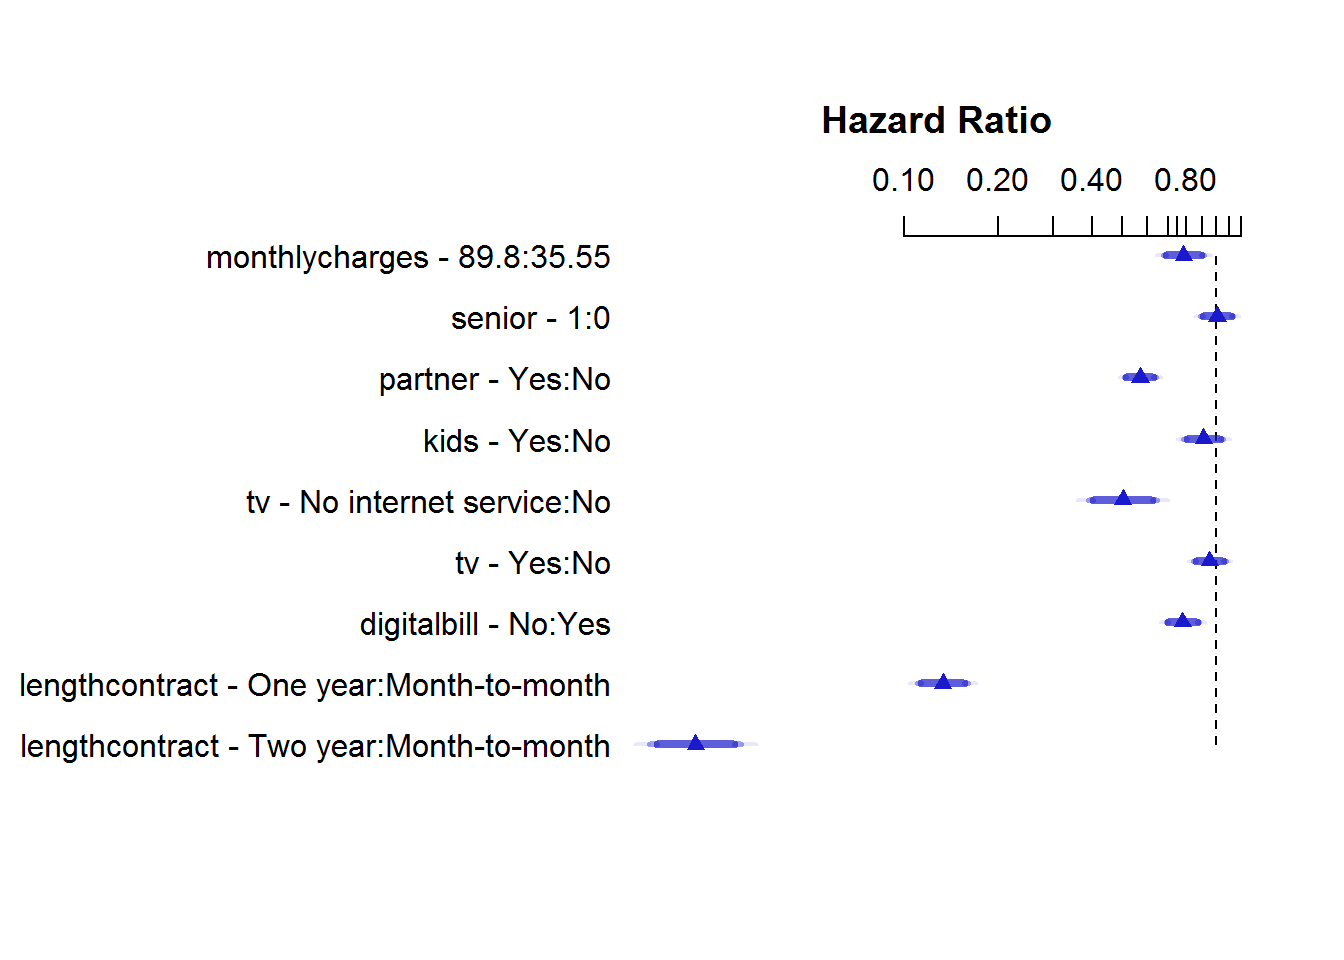
So, we can ask ourselves, according to this model, which variables affect most the tenure of a customer? We can calculate the hazard ratio (=risk of churning) by variable, which is a multiplicative effect of the variable on the churn function:
+A hazard ratio of 1 indicates no effect
+A hazard ratio > 1 indicates an increase in churn as the variable rises
+A hazard ratio < 1 indicates a decrease in the churn as the variable rises
So, in a logarithmic scale, we can say that:
1. Churn is slightly lower for customers with digital bills, (remember, correlation is not causation)
2. Churn is pretty low for customers in longer contracts,customer without internet service or customers with a partner,… clearly this is pointing to some specific customer segments
3. Being young or old has little efect on churn,as well as having kids or having TV-as-a-service.
##                senior=1             partner=Yes                kids=Yes
##              1.00655016              0.57081013              0.91161536
##  tv=No internet service                  tv=Yes         digitalbill=Yes
##              0.50227797              0.95244895              1.28036200
##          monthlycharges lengthcontract=One year lengthcontract=Two year
##              0.99557992              0.13328180              0.02152033
All in all, we have derived how the different variables affect churn,so sheddign light on which varaibles to act to reduce churn.
Action
As an example of the kind of hypothesis you can derive, the DIBB (data–>insight–>belief–>bet) method might help you throughout the journey, for example:
Different contracts work well from a retention perspective, except monthly contracts, specially during the first 2 months
insight. Customer not renewing contracts because of different reasons (probably customer friction in initial touchpointsbelief). Whether there is a need to improve the nurturing activities(bet) in the customer journey might be a good hypothesis based upon the analysis.Interesting to note that customers with highest LCV are the ones that usually churned (
insight), for all types of contracts. Looks like there is a push to sell, and eventually customers drop (belief) seeking an initially better offer from competitors, though it’s an hypothesys that need to be confirmed with additional data.
So far, we were able to gain some advanced insight from the past and suggest a few remedy actions to improve churn. This is just the beginning, because from here things will be getting more and more complicated. Having a reliable and smart data set from an organization with millions of customers, then doing a costly analysis after confronting with business leaders,…This is not easy and requires time. But now it’s when opportunities come out, so you can identify specific areas for improvement and frame and lunch laser-focused projects. This is another key learning when starting projects that are not mainstream yet, go for small bets before going for the moonshots!
Does this B2C case resonate to your business?
More info is available should you wanted to know more. Just get in touch
Survival algorithms consist of two parts,the firt one describes how the probability of churn per time unit changes over time at baseline levels of covariates; and second one, the effect parameters, describing how churn varies in response to explanatory variables (services contracted, type of customer,…).↩